The Galton Board (also known as a Bean Machine or Quincunx) is a device designed to demonstrate the Central Limit Theorem and the emergence of the normal distribution from random Bernoulli trials. It consists of a vertical board with staggered pegs and bins at the bottom. When balls are dropped from the top, they bounce off the pegs and land in one of the bins, forming a bell-shaped distribution.
1. Bernoulli Trials & Binomial Distribution
- - Each time a ball hits a peg, it has a binary outcome: it can fall either left or right (assuming a 50-50 probability).
-
- After *n* rows of pegs, the final position of the ball is the result of *n* independent Bernoulli trials.
-
- The number of right turns (*k*) follows a Binomial Distribution:
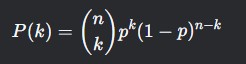
where p=0.5 (if the board is symmetric).
2. Central Limit Theorem (CLT)
- - As the number of pegs (*n*) increases, the distribution of the ball positions approaches a normal distribution (Gaussian distribution).
- - The CLT states that the sum (or average) of many independent random variables tends toward a normal distribution, even if the original variables are not normally distributed.
3. Mean and Variance
-
Mean (Expected Position): If the board is symmetric, the mean position is centered.
μ=
-
Variance (Spread): The spread of the distribution depends on *n* and *p*.
σ2=n⋅p⋅(1−p)
-
For large *n*, the distribution becomes approximately:
N(μ,σ2)
4. Physical Interpretation
- - Each peg represents an independent random event (left/right decision).
- - The final bin where a ball lands is the sum of all its random choices.
- - The bell curve emerges due to the law of large numbers—most balls take a roughly equal number of left and right turns, while extreme outcomes are rare.
5. Applications
-
-Demonstrates how randomness can lead to predictable patterns.
-
-Models real-world phenomena like diffusion, stock market fluctuations, and statistical sampling.
-
-Used in teaching probability, statistics, and statistical mechanics.
6. Mathematical Derivation (From Binomial to Normal)
For large *n*, the De Moivre-Laplace Theorem (a special case of the CLT) states that the Binomial distribution approximates a Gaussian:
This is why the Galton Board produces a bell curve when many balls are dropped.
The Galton Board visually demonstrates how simple random processes (left/right choices) lead to a normal distribution when repeated many times. It bridges probability theory and statistics, showing why the normal distribution appears so frequently in nature and experiments.
The Galton Board provides a foundational understanding of how randomness and probability distributions apply to the stock market. While the stock market is far more complex than a simple binomial model, the principles demonstrated by the Galton Board help explain key market behaviors, including price movements, risk modeling, and statistical arbitrage.
Key Applications of Galton Board Theory in Stock Markets
1. Random Walk Hypothesis & Stock Price Movements
The Galton Board illustrates how small, random steps (left/right bounces) lead to a normal distribution. Similarly, the Random Walk Hypothesis (from financial mathematics) suggests that stock prices follow a random path where:
- - Each price change is independent of past changes.
- - Prices reflect all available information (Efficient Market Hypothesis).
Mathematical Connection:
- - The binomial model (like the Galton Board) is used in option pricing (e.g., the Cox-Ross-Rubinstein model).
- - Over time, stock returns tend to approximate a log-normal distribution (since returns compound multiplicatively, unlike the additive Galton Board).
2. Brownian Motion & Geometric Brownian Motion (GBM)
The Galton Board’s limiting behavior (normal distribution) connects to Brownian Motion, which models stock price movements in continuous time.
-
Standard Brownian Motion (Wiener Process):
- - dWt represents random shocks (like Galton Board’s left/right steps).
-
- Geometric Brownian Motion (for stock prices):
- - Accounts for compounding returns (lognormal distribution).
3. Risk Modeling & Portfolio Theory
The Galton Board’s normal distribution is foundational in:
- - Modern Portfolio Theory (Markowitz Model) – Assumes returns are normally distributed.
- - Value at Risk (VaR) – Estimates potential losses using standard deviation (σ).
- - Black-Scholes Option Pricing – Uses GBM to model stock prices.
Limitation:
Real markets have fat tails (extreme events happen more often than a normal distribution predicts), which is why models like Student’s t-distribution or Levy processes are sometimes used instead.
4. Mean Reversion vs. Momentum Trading
- - Galton Board Analogy: If a stock’s price is far from its mean (far left/right bin), will it revert (central limit tendency) or trend further (momentum)?
- - Statistical Arbitrage exploits deviations from expected distributions (like pairs trading).
5. Monte Carlo Simulations for Trading Strategies
- - Traders simulate thousands of possible price paths (like dropping many balls in a Galton Board) to estimate probabilities of profit/loss.
- - Used in algorithmic trading and derivatives pricing.
6. Behavioral Finance & Herding Effects
- - The Galton Board shows how independent random actions lead to a predictable distribution.
- - In markets, herd behavior can distort this—instead of normal distributions, we see bubbles and crashes (fat tails).
Practical Example: Binomial Option Pricing
The Cox-Ross-Rubinstein (CRR) model applies Galton Board logic:
- - Stock price can move up (U) or down (D) each period (like left/right in the Galton Board).
- - After many steps, the option’s value is derived from the probability-weighted outcomes (like the distribution of balls in bins).
Limitations & Extensions
While the Galton Board is a useful analogy, real markets differ because:
- - Non-normal distributions (e.g., fat tails, skewness).
- - Volatility clustering (large moves follow large moves).
- - Correlated shocks (unlike independent pegs in the Galton Board).
Advanced models (e.g., GARCH, Jump Diffusion, Stochastic Volatility) extend these ideas.
- Randomness in stock prices (Random Walk Hypothesis).
- Option pricing models (Binomial & Black-Scholes).
- Risk management (VaR, Monte Carlo simulations).
- Behavioral market effects (herding vs. mean reversion).