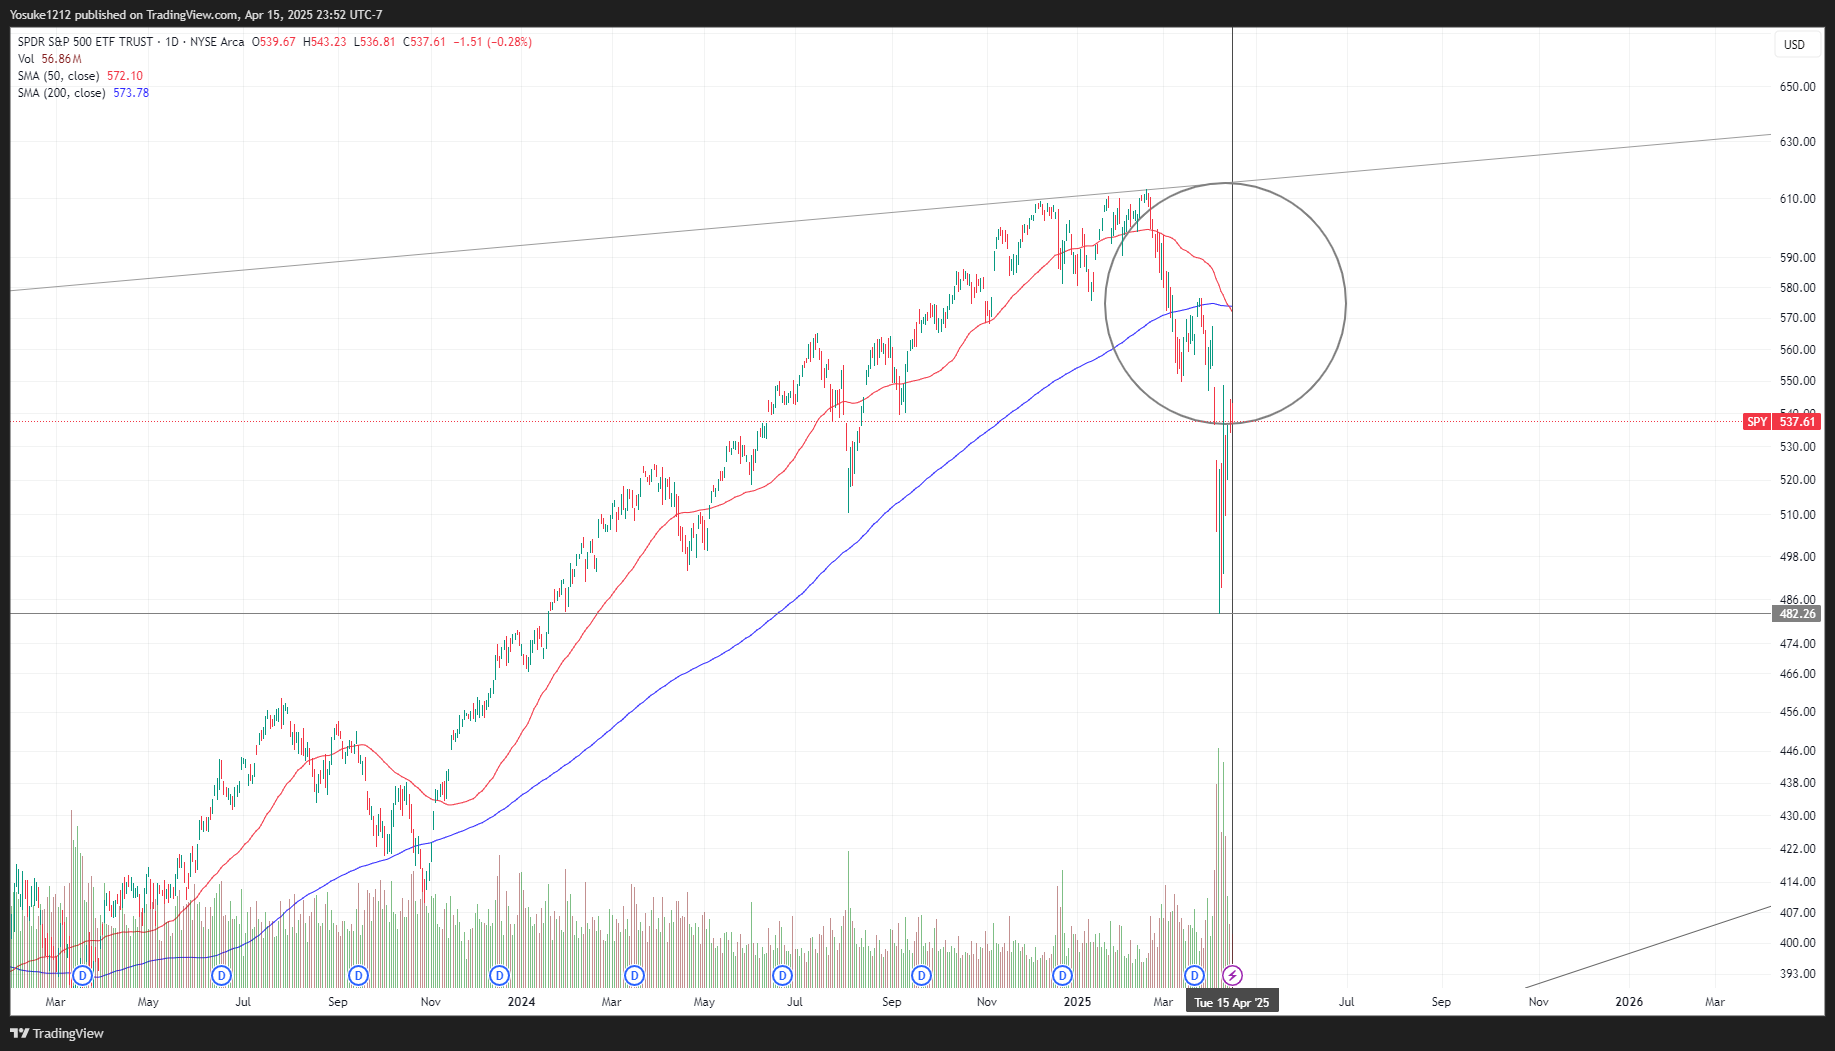
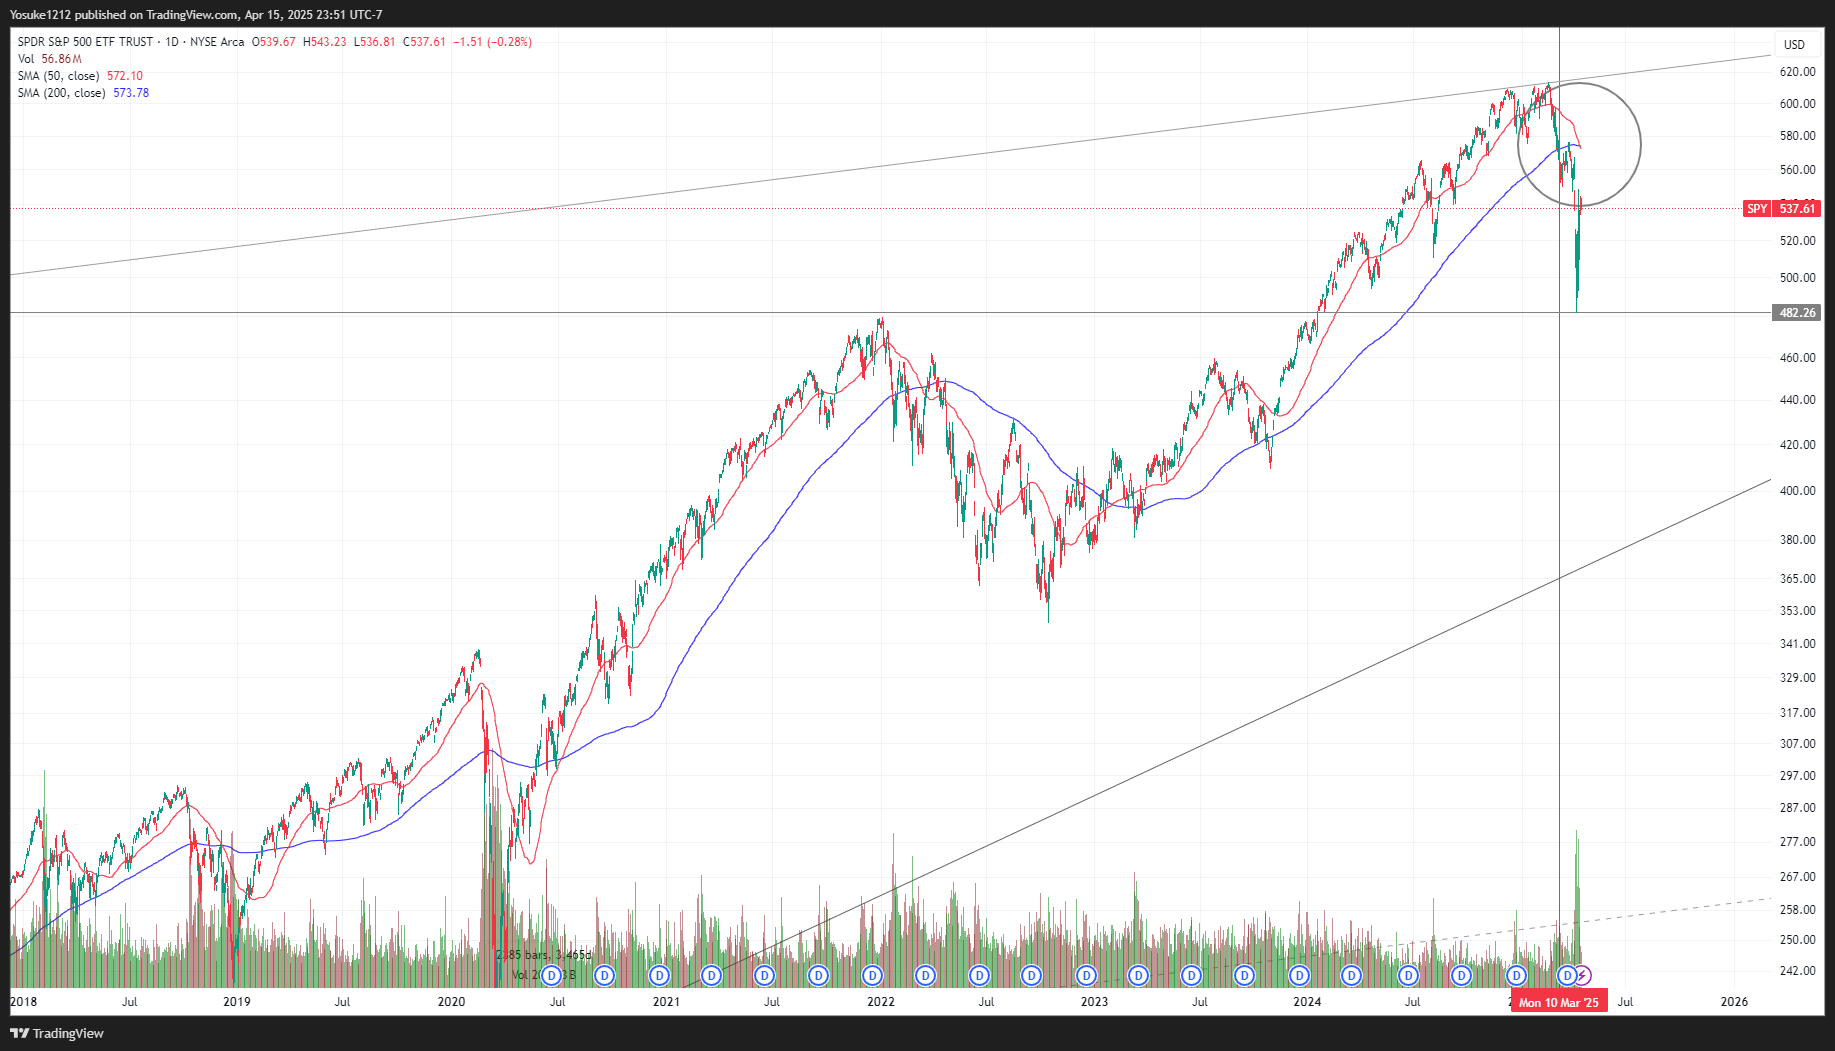
The S&P 500 created a Death Cross today. The S&P 500 index representing the U.S. economy started dropping since it topped on February 19, 2025, and hit its lowest bottom at $4,820 and bounced back rapidly. This drop was recorded as 21% dropping from the all-time high of $6,120. A short-term decline of 10% to 20% from a recent high is considered a correction in the stock market, and when prices fall 20% or more from a recent peak and sustain that decline, a bear market is confirmed. The question is what is happening with the current U.S. market? The recent drop showed greater than 20% and scares investors, institutions, and even many CEOs of the big companies.

For instance, Elon Musk, who strongly supported President Trump as the head of the Department of Government Efficiency (DOGE) to cut down Government spending since January 20, 2025, left the job two months after taking the role. It was primarily due to the backlash from the public and witnessing the sudden drop of TESLA stock from $488 down to $214 at the end of March. The highest capital TSLA experienced around the all-time high at $488 was just over $1.5 trillion and dropped down to $670 billion, which is a 56% loss. This happened within two months. Even though the TSLA stock was way overvalued than it should have, Elon Musk still significantly relies on the invested money to scale up the companies, not only TESLA, SpaceX, X, and any other companies he owns. So, witnessing the price decline like that is excruciating without a doubt.
The general market went down 21 % and rebounded quickly to recover 10%. Now what? This is the question we want to ask ourselves because if the market is correcting, we definitely want to keep the money in the market and enjoy the quick recovery to the top of the all-time high and more. On the other hand, if not, we'd better stay away from the market period, especially if you are a short trader or investor. Is a Bear market right around the corner and causing economic downturns, recessions, or negative investor sentiment now? One of the major technical analysis indicators confirmed today,y 4/15/2025, that the S&P 500 just experienced a "Death Cross", which was created by the Simple Moving Average (SMA) 50 days (red line) and 200 days (blue line).


The last time it happened was in March 2022; the one before that was in March 2020 due to the COVID-19 pandemic. Now it is happening again, in March 2025. The trend seems to be declining during the season around March, is it a coincidence? Congratulations! If you noticed that. However, I would like to discuss the topic in some other post because I want to focus on having a Death Cross indication in the S&P 500 today. Investors who use the 50-day and 200-day Simple Moving Averages (SMA) are typically trend followers and technical traders who want to identify the long-term market direction and key entry/exit points. Here’s who prefers these SMAs and why:
Why are 50-day and 200-day Simple Moving Averages (SMA) important?
- The 200-day SMA acts as a bull/bear market divider:
Price above = Uptrend (bullish)
Price below = Downtrend (bearish)
- The 50-day SMA helps spot short-term momentum:
A 50-day > 200-day (Golden Cross) = Strong uptrend
A 50-day < 200-day (Death Cross) = Strong downtrend
What are the indications of 50-day and 200-day Simple Moving Averages (SMA)?
- Golden Cross (50 crosses above 200) → Buy signal
- Death Cross (50 crosses below 200) → Sell signal
Famous Investors Using 50/200 SMA
<Paul Tudor Jones>
Legendary hedge fund manager and founder of Tudor Investment Corporation. He is known for saying: "As long as a stock is above its 200-day moving average, I'm long. If it goes below, I get out." His investing style is trend-following and macro trading. He uses technical indicators like SMA 200 to manage risk and follow market momentum.
<Stan Weinstein>
Author of “Secrets for Profiting in Bull and Bear Markets.” He utilizes the SMA 200 Strategy and advocates using the 200-day SMA as a core component of his stage analysis and uses that as one of the clearest proponents of using the SMA 200 as a trend filter. He emphasizes buying only when a stock is above a rising 200-day SMA.
<William O’Neil>
Founder of Investor’s Business Daily (IBD) and author of “How to Make Money in Stocks.” He recommends avoiding stocks trading below their 200-day moving average and considering it a bearish sign.
<Mark Minervini>
U.S. Investing Champion and author of “Trade Like a Stock Market Wizard.” He looks for stocks that are in strong uptrends, often using the 200-day SMA as a key reference for overall trend direction. His investment style is momentum-based trading and focuses on technical strength.
<Steve Burns>
Trader, author, and founder of New Trader U. SMA 200 Strategy. He frequently writes about the value of trading above or below the 200-day SMA as a trend-following method.
<Charlie Munger>
A well-known long-term investor who is Warren Buffett's longtime business partner at Berkshire Hathaway. Charlie Munger Strategy: Buy Quality Stocks at 200-Week Moving Average.
When an investor sees a Death Cross (50-day SMA crossing below the 200-day SMA), it is generally considered a bearish signal, suggesting potential further downside. You should consider reducing risk exposure by trimming long positions (sell partial holdings), and avoid new aggressive buys until a reverse trend signals show otherwise. Shifting to defensive sectors such as utilities, consumer staples, or gold is a great strategy. In fact, I emphasized the price increment of Gold in a recent post (Bloomberg US Corporate High Yield Spread on S&P 500).